One collector, two pipelines, one memory
In Part II we added
otelcol.processor.memory_limiter to protect the collector from running out of
memory, and I recommended the percentage settings (limit_percentage = 80). We
potentially miss some important nuance there. And while testing this, I ran into
a second problem that turned out to be the more interesting one.
Here is the setup. Grafana Alloy lets you run two pipelines in a single collector: one receiving OpenTelemetry (OTLP) data, the other scraping Prometheus metrics. It is a tempting layout: one deployment, one thing to operate, one config to maintain.
The catch is that the memory limiter only protects the OTLP pipeline. The Prometheus pipeline runs right past it, and both share the same process memory. So when the Prometheus side misbehaves, one of two things happens: it starves the OTLP pipeline that was doing nothing wrong, or it takes down the whole collector.
I reproduced both failures on a small kind cluster sending data to Grafana Cloud, and I will walk through them below, along with what actually helps on the Prometheus side.
First, the correction
Part II suggested limit_percentage = 80. The trap: the percentage is
calculated against the total memory of the host or node, not against the
container's memory limit.
Think about what that means inside a 256 MiB pod running on a large node. "80 percent" resolves to several gigabytes, a number the pod will never be allowed to reach. Kubernetes kills it long before the limiter would ever kick in. So in a container, use fixed sizes, set below the container limit:
otelcol.processor.memory_limiter "guard" {
  check_interval = "1s"
  limit          = "180MiB"   // hard limit, below the 256Mi container limit
  spike_limit    = "40MiB"    // soft limit = 180 - 40 = 140MiB

  output { ... }
}
What memory_limiter can and cannot reach
It helps to be precise about what this processor actually does. Once per second it checks how much memory the process is using. If usage is too high, it starts refusing new data. Refusing means it returns an error to the OTLP receiver in front of it, which in turn tells the sender to back off. That is the entire mechanism. Its only tool is pushback, and pushback only works on data flowing through the OpenTelemetry pipeline.
The Prometheus pipeline never enters that pipeline. prometheus.scrape collects
samples, prometheus.relabel rewrites them, prometheus.remote_write ships
them out. None of it passes a point where the limiter could refuse, drop, or
slow anything. There simply is no memory limiter on the Prometheus side.
Both pipelines still run in one process, though, with one Go heap between them. Every series the scraper loads and every batch sitting in the remote-write queue counts toward the same number the limiter is watching. The limiter sees the pressure fine. It just cannot do anything about the cause. All it can do is throttle the OTLP side, so the pipeline that created the problem keeps running while the innocent one gets punished.
Reproducing it
My test setup: a kind cluster with a single Alloy deployment running both
pipelines, plus two load generators. telemetrygen provides a steady, healthy
OTLP stream. avalanche acts as a tunable Prometheus cardinality bomb.
Everything ships to Grafana Cloud, and Alloy scrapes its own metrics so the
failure shows up on a dashboard.
I ran two scenarios. The only differences between them are how hard avalanche pushes and how much memory the container gets.
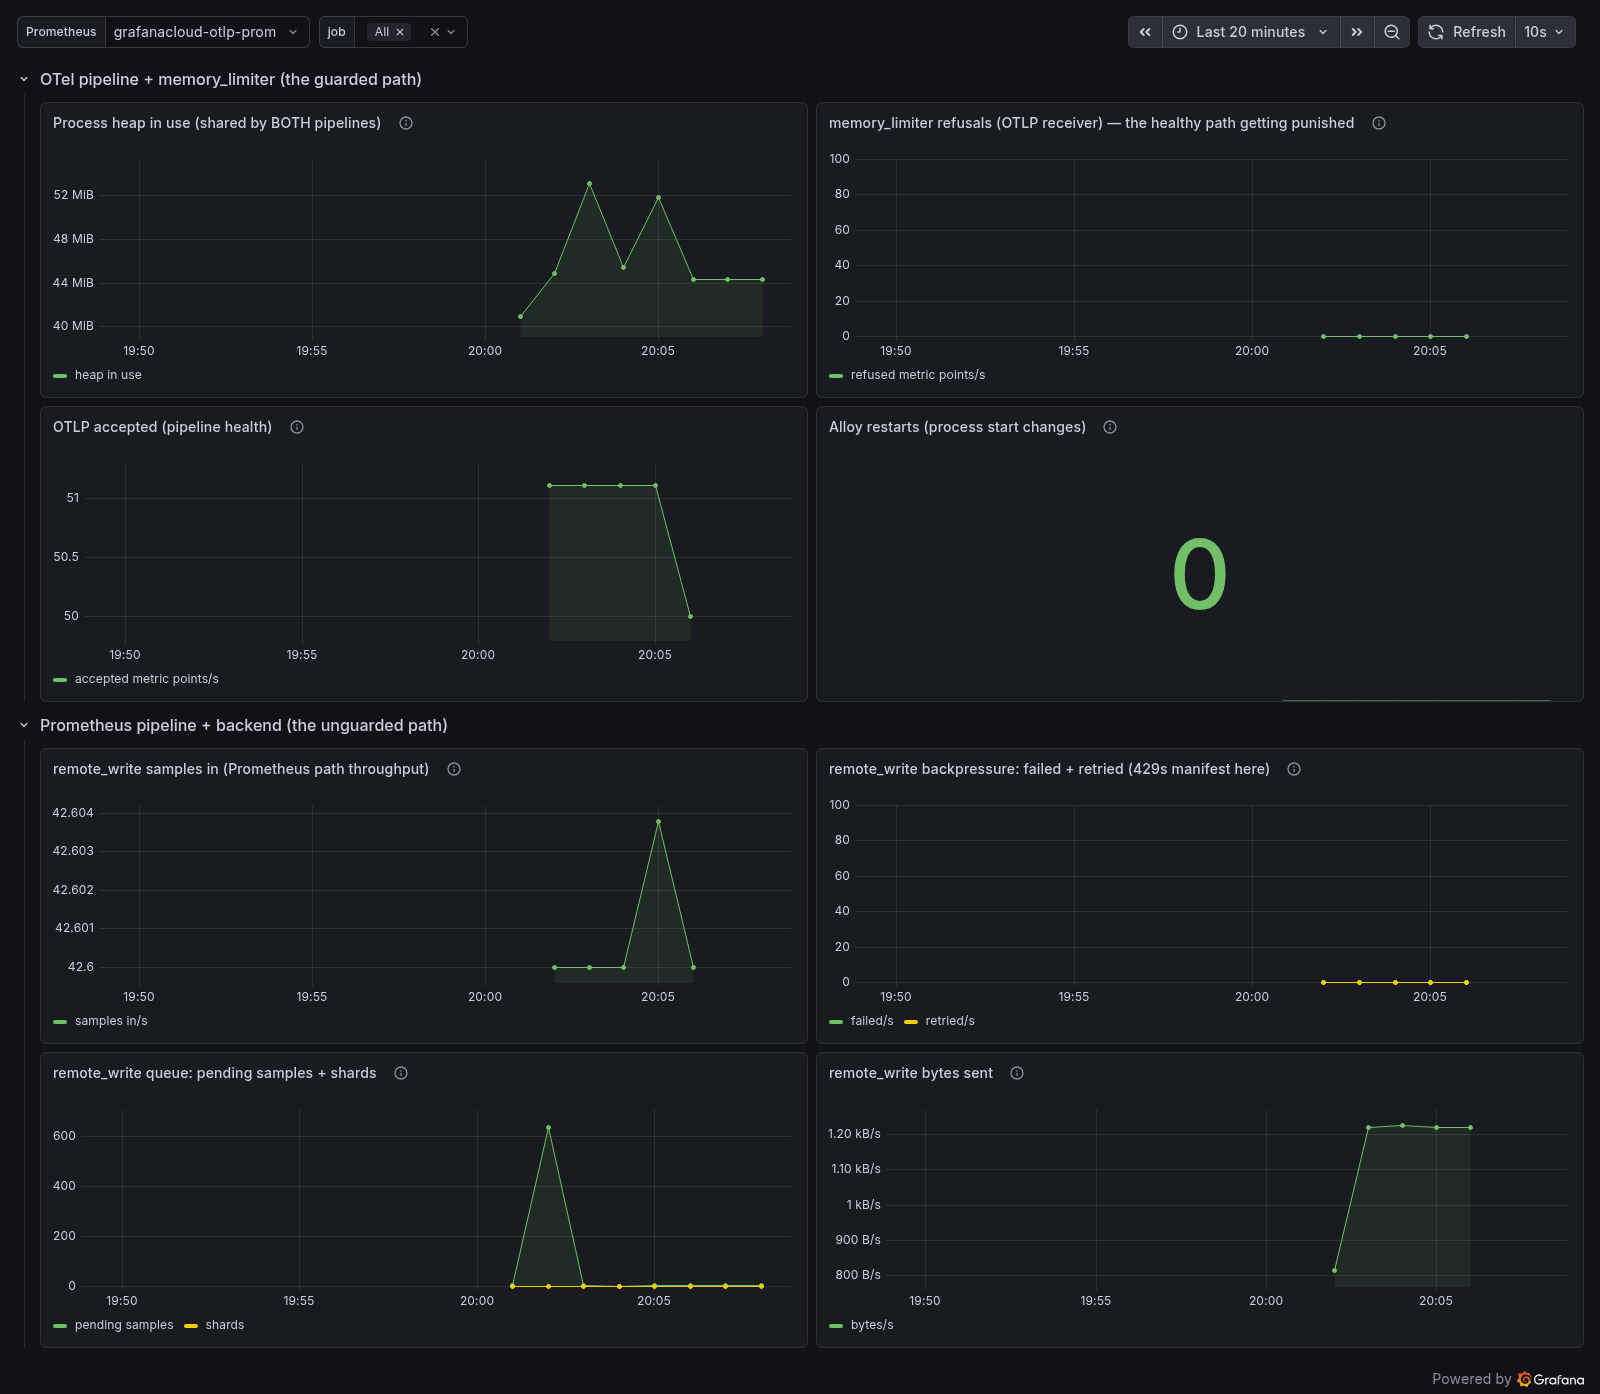
Problem one: the fast OOM (limiter is skipped)
Container limit: 256 MiB. avalanche serving roughly 400,000 series.
On each scrape, Alloy has to load and parse all of those series into memory at
once, which shoves the heap to around 410 MiB in under a second, faster than the
limiter's one-second check interval. The Linux kernel notices the container
blowing through its memory limit and kills it (exit code 137) before the limiter
ever runs. Kubernetes reports the pod as OOMKilled, restarts it, and the cycle
repeats.
lastTerminatedReason = OOMKilled   exitCode = 137   restarts keep rising
otelcol_receiver_refused_metric_points_total = 0   (the limiter never ran)
Notice the limiter is not protecting the wrong pipeline here. It is skipped entirely. And honestly, even if its check had fired in time, it would not have mattered: the limiter can only refuse data at the OTLP receiver. It has no lever on a scrape that is already being read and parsed.
There is a nasty side effect too. When the collector dies, it stops sending its own metrics, so exactly the data you would want for diagnosing the problem disappears with it. A collector that runs out of memory goes blind while it falls.
Problem two: the slow cascade (limiter starves the healthy pipeline)
For the second scenario I gave the container more room, 1 GiB, so that the
limiter, not Kubernetes, becomes the effective limit. avalanche now serves a
steady 40,000 series. I deliberately kept the limiter at limit = "180MiB" from
the previous scenario. That obviously does not match a 1 GiB container, but that
is the point: the heap will sit permanently above the hard limit, which lets us
watch what the limiter does when it is always on.
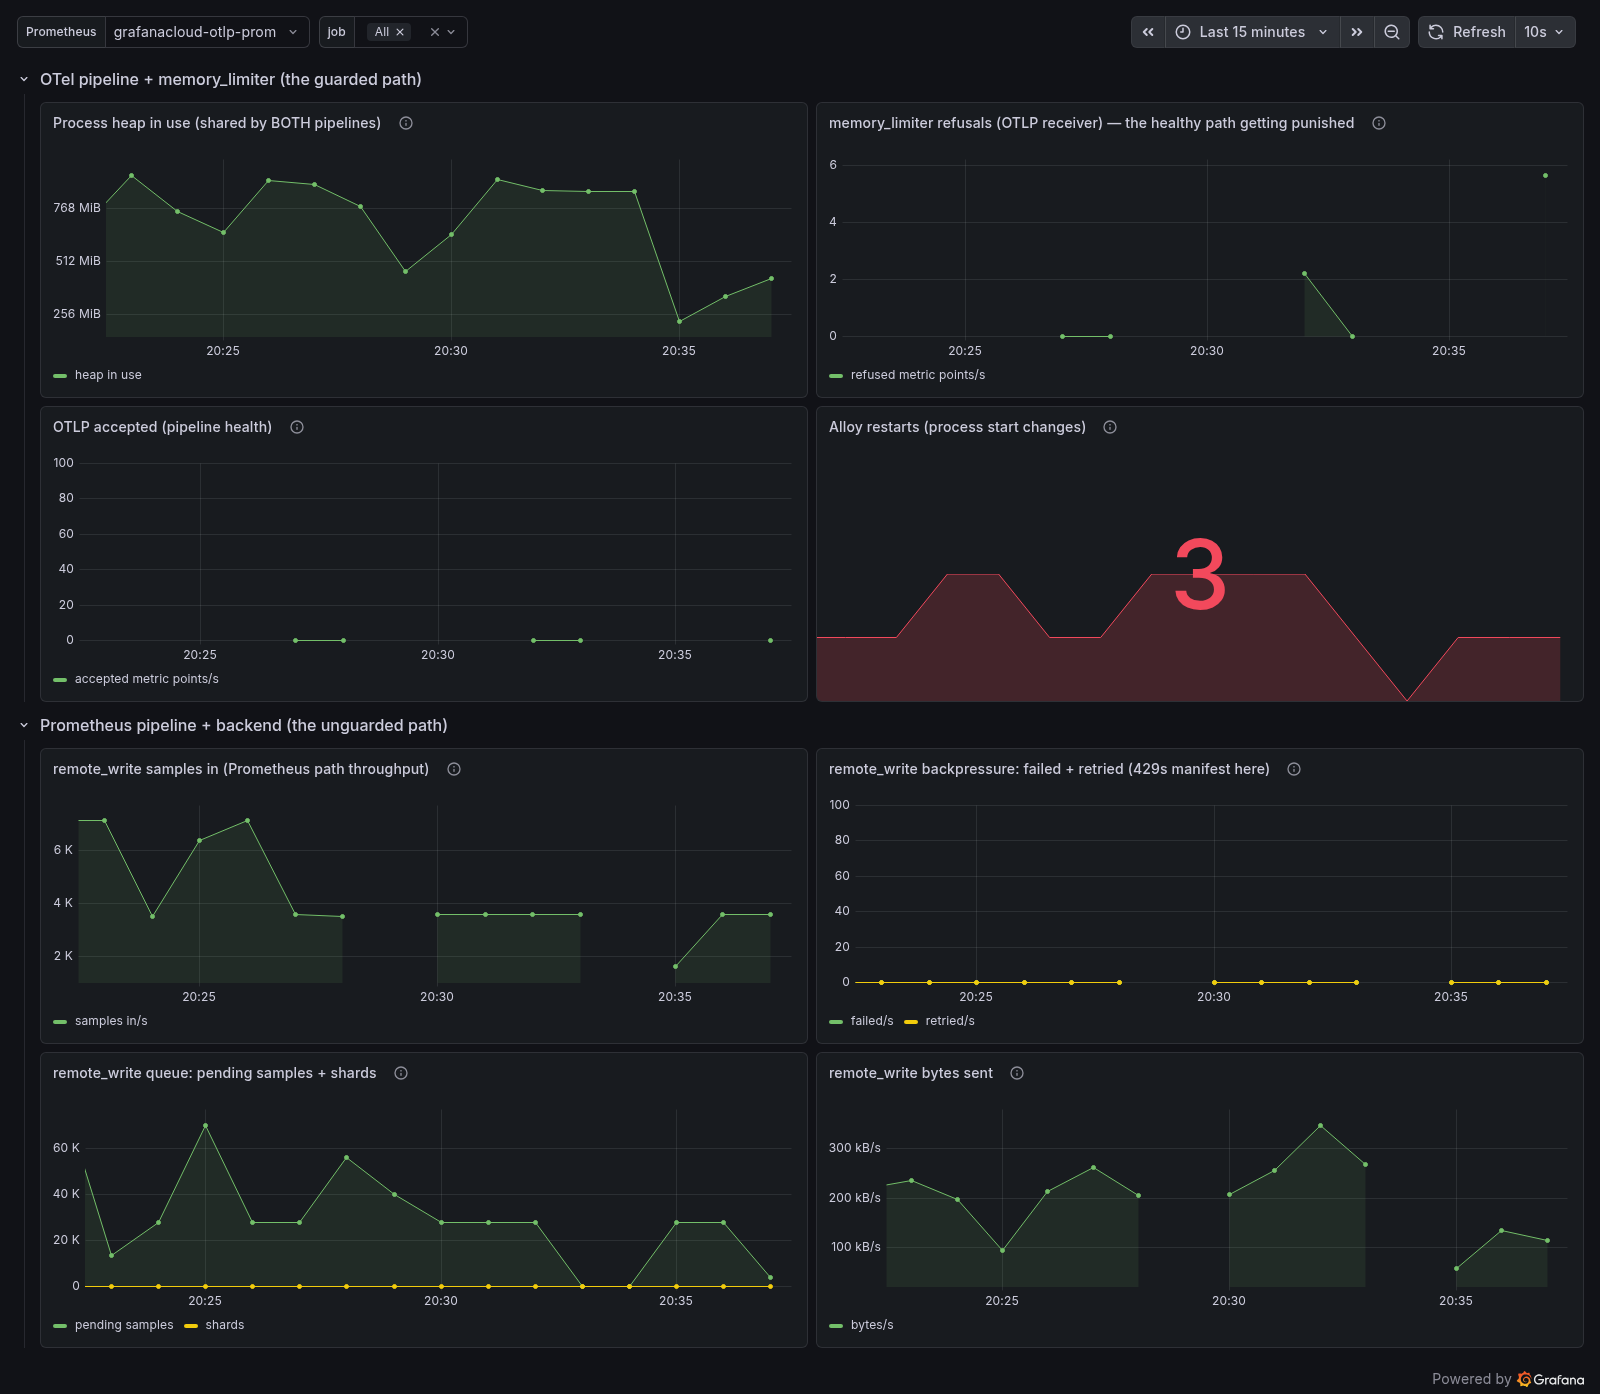
The heap climbs and settles somewhere between 256 and 900 MiB. Worth pausing on that number, because 40,000 series alone do not need anywhere near that much. The rest is everything around them: parse buffers allocated on each scrape, the remote-write queue and its shards, the WAL being replayed after each restart, and heap the Go runtime has not returned yet.
Either way, it is far above the 180 MiB hard limit, so the limiter does exactly
what it is built to do: it refuses OTLP data. On the dashboard,
otelcol_receiver_refused_metric_points_total climbs while
otelcol_receiver_accepted_metric_points_total drops to zero. The healthy
telemetrygen stream is being dropped on the floor.
Meanwhile the Prometheus pipeline, the one causing all of this, is not slowed at
all. prometheus.remote_write keeps pushing 6,000 to 7,000 samples per second
(about 250 kB/s) to the backend. The pipeline at fault floods the backend; the
healthy one starves. This run already had GOMEMLIMIT set, by the way, and the
heap still spiked near the limit on each scrape, so the collector restarted a
few times regardless. GOMEMLIMIT bounds the steady-state heap. It does nothing
for these sudden spikes.
How to protect the Prometheus path
The Prometheus pipeline has its own controls, and combined they keep one noisy target from taking the collector down.
- Set
GOMEMLIMIT(the most convenient option). Unlike the memory limiter, which only sees the OTLP pipeline,GOMEMLIMITis a Go runtime setting that covers the whole process. As the heap approaches the limit, the garbage collector works harder and frees memory for both pipelines, Prometheus path included. One environment variable, set a bit below the container limit (around 90 percent):
env:
  - name: GOMEMLIMIT
    value: "230MiB"   # about 90% of the 256Mi container limit
Necessary, but not sufficient. It is a soft limit: it holds the steady-state heap down by making GC more aggressive, but it cannot stop a sudden scrape spike, and both failures above happened with it set. Very aggressive GC also costs CPU. Treat it as the baseline and add the limits below on top.
- Limit the scrape.
prometheus.scrapesupportsbody_size_limit,sample_limit, andlabel_limit, and they are not interchangeable.body_size_limitcaps how many bytes Alloy will read from a target, which bounds the memory used while ingesting a huge response. This is the one that helps against the fast OOM above.sample_limitis only checked after the body is parsed: it rejects scrapes with too many series, which protects the remote-write queue and the backend, but does nothing for the short parse spike.
prometheus.scrape "targets" {
  body_size_limit = "10MiB"   // caps bytes read -> limits the parse spike
  sample_limit    = 50000     // rejects after parse -> protects queue + backend
  label_limit     = 30
}
- Limit the remote-write queue.
queue_config(capacity, max shards) controls how much remote-write is allowed to hold in memory when the backend is slow.
prometheus.remote_write "cloud" {
  endpoint {
    url = "..."
    queue_config {
      capacity   = 2500
      max_shards = 50
    }
  }
}
- Drop series before remote-write. Use
prometheus.relabelwith akeepordropaction so only the series you actually need reach the remote-write queue. That shrinks what the queue and the WAL hold in collector memory. The scrape still loads everything for a brief moment, so pair this withsample_limit.
prometheus.relabel "keep_needed" {
  rule {
    source_labels = ["__name__"]
    regex         = "go_.*|process_.*|up"
    action        = "keep"
  }
}
One note here: Grafana Cloud Adaptive Metrics also reduces cardinality, but it runs in the backend, after the collector has already sent the data. It lowers storage and cost, not collector memory.
- Split the collectors. The safest option of all: run the noisy Prometheus scraping in its own collector with its own memory budget. A cardinality spike there can no longer starve or kill an OTLP pipeline it does not share memory with.
Summary
otelcol.processor.memory_limiter protects one pipeline, not the whole process.
In a mixed collector it can only throttle the OpenTelemetry side, even when the
Prometheus side is the real cause. And with a small container limit it does not
even get the chance to run.
If you run both pipelines in one Alloy collector, give the Prometheus path its own limits, or give it its own collector. Do not expect the memory limiter to cover the Prometheus side. It never did.